Understand the Market Like a Puzzle: Decoding the Inner Logic of Liquidity, Spread, and Market Movement

Original Article by: TradeStream | Improve Your Trading
Original Article Translated by: DeepFlow Tech
Trading: If we choose to act in a place where most people are willing to trade based on common sense... then this may mean that we do not have more valuable information than others.
One Metaphor of Market Behavior: Jigsaw Puzzle
I like to use a jigsaw puzzle to describe market behavior. You can imagine the overall market as a person trying to complete a puzzle, with the trading volume being the puzzle pieces. The market will strive to put all the pieces together. By analyzing the distribution of trading volume, we can more clearly see where "pieces" are missing. When the market finds areas with more pieces (i.e., higher trading volume and time accumulation), it will try to allocate these pieces to areas with fewer pieces (i.e., lower trading volume and time).
How the Market Chooses Direction
Sometimes, when both sides of the market lack "pieces," how can we determine which side it will fill first?
This reminds me of a theory about human behavior in the book "Atomic Habits." In such situations, we need to focus on two key points:
Attraction: People usually hope that their actions will bring rewards, and the market is the same because it reflects human behavioral patterns. As we discussed earlier, we tend to avoid overly crowded trading scenarios, and a more attractive strategy is often trading against the majority of mispositioned participants, especially when we have clear structural reasons.
Reducing Resistance: According to the "law of least effort," the more effort something requires, the less likely it is to happen. If the resistance is too high, the difficulty of achieving our goal will also increase.
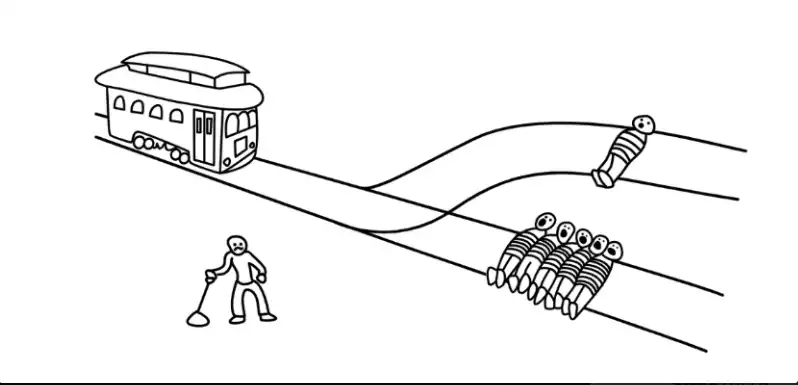
Another Metaphor of Market Behavior: Trolley Problem
Imagine the market as a train, and this train is like an "executioner" eager to "hunt." When we take action in the fair value area, both sides of the market are crowded with participants, making it difficult to predict which side the market will "hunt" more people. However, once the market chooses a side, the other side becomes the only choice, making our decision-making simpler.
What is Liquidity?
Liquidity refers to whether there are enough counterparties in the market to trade with. When we trade, we are either consuming liquidity or providing liquidity. If the price is stable in a certain area (i.e., a balance area) or unable to fluctuate smoothly, it is because buyers have not consumed enough liquidity; conversely, if the price can fluctuate smoothly, it means that buyers have successfully consumed enough liquidity.
Limit Order vs. Market Order
A limit order is a tool for "adding liquidity," while a market order is a tool for executing a trade and consuming this liquidity. Passive liquidity (limit orders) is often more impactful because limit orders typically determine market structure, while aggressive market orders will be absorbed at key points.
Why is a limit order more impactful? Because when you execute a market order, you need to cross the bid-ask spread, which means you will immediately be in an unrealized loss position after placing the order.
What is the Spread?
The spread is the difference between the asset's buy price (advertisement bid) and sell price (advertisement ask). Market makers provide liquidity through the spread, meaning the price to immediately buy an asset is usually slightly higher than the market price, while the price to immediately sell is slightly lower than the market price.

Let's assume an asset's current price is $10.00, and an asterisk (*) represents one contract. If we want to buy immediately, there is no $10.00 quote in the market because if there were, the market maker would not profit. Therefore, they would set the advertised liquidity slightly higher, for example, placing four contracts at $10.01 to capture this small difference.
If we decide to buy three contracts, we would transact at the $10.01 price. But what if we want to buy more, say 15 contracts? We would need to cross the spread until we find enough orders to fulfill the trade. As a result, the price would eventually be pushed to $10.03 because only at this price level are there enough contracts to meet our demand.

Through this example, we can understand why limit orders are usually more impactful. Small-scale traders have a negligible impact on the price as they will not encounter significant slippage. However, if someone wants to buy 500 contracts and there is not enough liquidity nearby, they will have to cross a significant spread, causing substantial price fluctuations.
If traders choose to place orders where liquidity is abundant, they can avoid significant slippage. So, where is liquidity usually concentrated? The answer is above swing highs and below swing lows. This is because most technical analysis-based traders exhibit similar behavior in setting stop-loss orders, and these locations are often where stop-losses cluster, making price reversals likely at these points.
So, their stop-loss is your entry point? Indeed.
Summary
· Impatient buyers or sellers are driving the price through market orders (taker), consuming liquidity.
· More patient buyers or sellers are preventing price fluctuations through limit orders (maker).
We can use a metaphor to describe this: market orders are like a hammer, while limit orders act as the floor or ceiling of a building. Breaking through the floor or ceiling requires sufficient hammer force to do so.

What happens when the floor is broken? The price quickly moves to the next floor.

Once the price reaches the next floor, upward movement becomes easier because the ceiling has been broken, creating a "gap" that allows the price to more easily fluctuate in areas of scarce liquidity.

Liquidity cascading is a very effective way to make money because at this point, we are trading with a price-insensitive group that is forced to transact (e.g., liquidated traders). But we need to be clear about what we are trading.
If you are trading liquidity premium, this effect is usually very short-lived, lasting a maximum of 10-15 seconds. In a cascading environment, this situation changes. In this case, you need to assess whether liquidity has fully recovered from the initial volatility.
Although the chain reaction of momentum shifts is not as reliable as liquidity premium, its sustainability is stronger (many people think they are trading liquidity premium when, in fact, they are trading this momentum effect).
The first method (liquidity premium) is more suitable for PNL attribution (i.e., analyzing the reason for making money) and is also the more ideal way to operate. The second method (momentum effect) captures the core part of large fluctuations but comes with greater volatility and looser risk control.
Overall, liquidity cascades lead to a supply-demand imbalance as a large number of price-insensitive traders enter, causing the order book to not withstand so many aggressive traders. But once the market stabilizes, the price will more easily return to those areas that failed to accumulate enough volume due to rapid fluctuations.
After all, the market is a two-way auction mechanism that usually tests low-volume areas for two reasons:
· There is less path resistance;
· The market seeks efficiency and will test these areas to see if anyone is willing to trade at those price levels.
As a result, the market will experience a "mechanical bounce back," as the order book needs time to rebalance. During this time, only a small amount of trading volume is needed to drive price fluctuations. Once the market settles, price movements will rely more on momentum, accompanied by increased volatility, but also allowing for greater profit potential.
Remember, high volatility often begets high volatility, while low volatility often begets low volatility, a phenomenon known as volatility clustering. Therefore, seize the opportunity and adjust your risk management strategy based on each change in market conditions.
You may also like

Morning News | Bitmine issues preferred shares to raise $300 million; Polymarket accuses Kalshi of industrial espionage

Privacy coin trust crisis! ZEC plummets over 56% in a single day

Who is leading the price discovery in the cryptocurrency market? Measured delays on platforms like Binance and Hyperliquid

Anthropic launches IPO: Business miracle or valuation bubble?

What Is SpaceX IPO and Why Is Everyone Talking About It?
Macroeconomic Analysis of the African Payment Market Landscape

Morning Report | Coinbase Ventures makes its first investment in ENA; SpaceX plans to set the IPO price at $135 per share

Full text and analysis of the speech by the CEO of SanDisk at the 42nd Annual Strategic Decision Conference of Bernstein

Bitcoin Price Prediction 2030: Ark Invest Forecasts $710K

WEEX Review 2026: Fees, Security and Trading Features

SOL Price Today: Live Solana Price, Charts & Market Data

What Is a Bitcoin ETF: Spot vs Futures Explained

Why Is Bitcoin Dropping 15% While Nasdaq Hits Record Highs?

Morning Report | Robinhood completes acquisition of WonderFi for $180 million; Anthropic submits IPO draft application to SEC confidentially; Google plans to raise $80 billion in financing

Why do I still have confidence in ETH?

CRCL surges and plummets, COIN follows with a dive: The real battle for interests behind the CLARITY Act

Tokenized US stocks are not the "liquidity killer" of the crypto market